Spring Test Profiler
Analyze & Accelerate Your Spring Boot Tests
Stop Waiting for Slow Spring Boot Tests
Slow and Unpredictable Test Suites Are Killing Your Productivity
Your test suite shouldn't be a productivity killer.
If your Spring Boot tests take 15+ minutes to run, fail unpredictably, or force developers to skip testing locally, you're losing valuable development time and shipping more bugs.
Are you tired of waiting for your Spring Boot test suite to complete? Do you struggle with:
- Flaky tests that fail randomly, breaking your CI/CD pipeline without clear reasons
- No visibility into which tests are actually slow or consuming the most resources
- No actionable insights on how to optimize your test performance
Every minute spent waiting for tests is a minute not spent building features your users need. Poor test performance doesn't just slow you down - it creates a culture where developers skip running tests locally, leading to more bugs in production.
Optimize Spring Context Caching for Faster Builds
Spring Test Profiler Reveals the #1 Performance Killer in Spring Boot Test Suites
Misusing Spring's TestContext context caching.
The Profiler helps you:
- Context Reload Analysis - Identify which tests are forcing expensive Spring context recreations and why
- Cache Optimization - Get specific recommendations to maximize context reuse across your test suite (often 50-80% faster execution)
- Performance Bottlenecks - Pinpoint slow tests with detailed metrics on execution time, memory usage, and context loading overhead
- Smart Test Grouping - Learn which tests can share contexts and which need isolation for optimal parallel execution
- CI/CD Integration - Track context cache efficiency over time and catch performance regressions
See the Impact
Real results from real projects: dramatically reduced build times
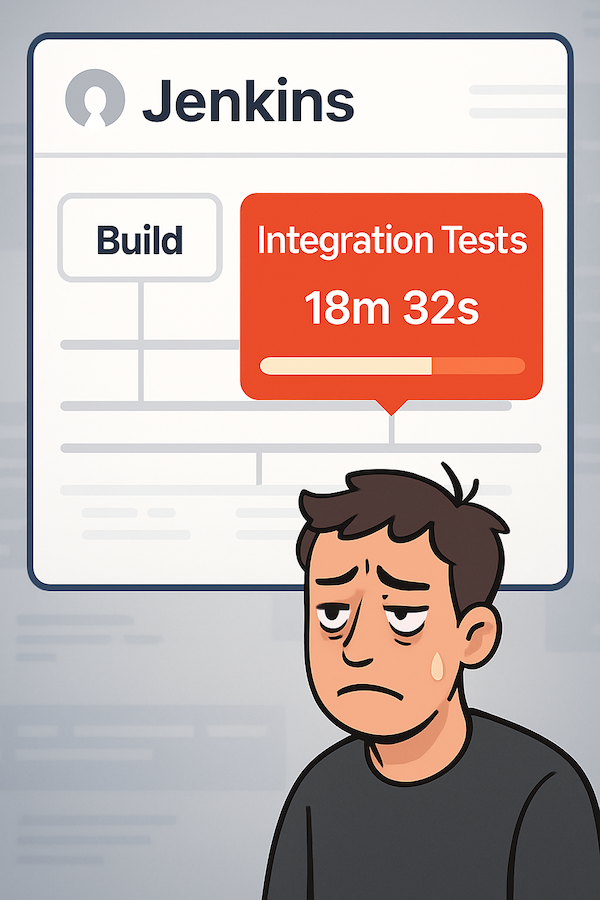
Before Optimization
Slow, unpredictable test execution
$ ./mvnw verify

[INFO] -------------------------------------------------------
[INFO]  T E S T S
[INFO] -------------------------------------------------------
[INFO] Running com.example.UserServiceTest
[INFO] Tests run: 15, Failures: 0, Errors: 0, Skipped: 0, Time elapsed: 8.429 s
[INFO] Running com.example.PaymentControllerTest
[INFO] Tests run: 8, Failures: 0, Errors: 0, Skipped: 0, Time elapsed: 5.234 s
[INFO] Running com.example.OrderProcessingTest
[INFO] Tests run: 12, Failures: 0, Errors: 0, Skipped: 0, Time elapsed: 7.891 s
[INFO] Running com.example.DatabaseIntegrationTest
[INFO] Tests run: 6, Failures: 0, Errors: 0, Skipped: 0, Time elapsed: 12.567 s

[INFO] Results:
[INFO] Tests run: 247, Failures: 0, Errors: 0, Skipped: 0
[INFO]
[INFO] ------------------------------------------------------------------------
[INFO] BUILD SUCCESS
[INFO] ------------------------------------------------------------------------
[INFO] Total time: 18:32 min
[INFO] Finished at: 2025-01-15T10:45:23+01:00After Optimization
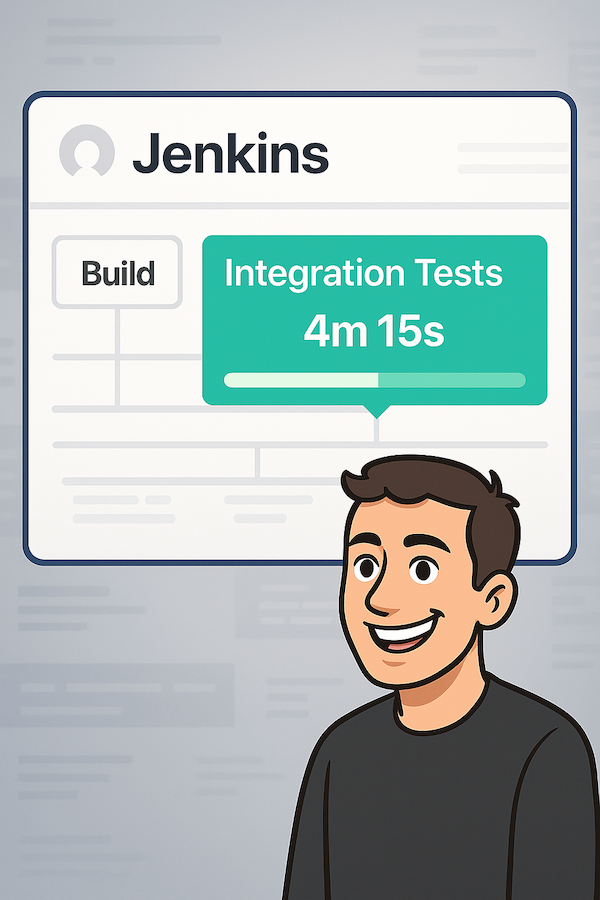
Fast, efficient test execution
$ ./mvnw verify

[INFO] -------------------------------------------------------
[INFO]  T E S T S
[INFO] -------------------------------------------------------
[INFO] Running com.example.UserServiceTest
[INFO] Tests run: 15, Failures: 0, Errors: 0, Skipped: 0, Time elapsed: 2.124 s
[INFO] Running com.example.PaymentControllerTest
[INFO] Tests run: 8, Failures: 0, Errors: 0, Skipped: 0, Time elapsed: 1.456 s
[INFO] Running com.example.OrderProcessingTest
[INFO] Tests run: 12, Failures: 0, Errors: 0, Skipped: 0, Time elapsed: 1.789 s
[INFO] Running com.example.DatabaseIntegrationTest
[INFO] Tests run: 6, Failures: 0, Errors: 0, Skipped: 0, Time elapsed: 2.234 s

[INFO] Results:
[INFO] Tests run: 247, Failures: 0, Errors: 0, Skipped: 0
[INFO]
[INFO] ------------------------------------------------------------------------
[INFO] BUILD SUCCESS
[INFO] ------------------------------------------------------------------------
[INFO] Total time: 04:15 min
[INFO] Finished at: 2025-01-15T10:46:35+01:00Sample HTML Report
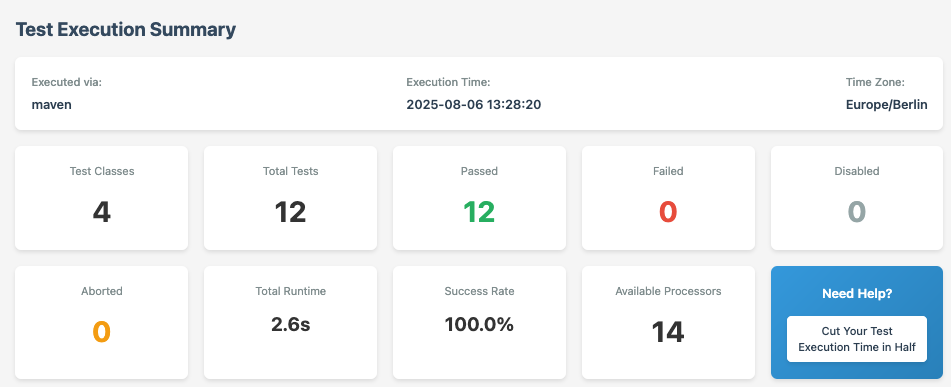
See what insights Spring Test Profiler provides with our comprehensive reporting
Spring Test Profiler Report
This is a live example of the HTML report generated by Spring Test Profiler.
Key Features
Everything you need to optimize your testing workflow
Performance Analytics
Test execution analysis and performance metrics
Resource Tracking
Context timing and resource usage tracking
Context Comparison
Test Context comparison to improve cache usage
Optimization Engine
Slow test detection and optimization suggestions
CI/CD Integration
Integration with popular CI/CD tools
Rich Reporting
Comprehensive reporting and dashboards
See It In Action
Visual walkthrough of Spring Test Profiler
Report Overview
Recommendations

Context Detail View

Context Comparison

Want to Explore the Full Report?
See all the insights and recommendations in action with our interactive sample report.
View Interactive Sample ReportSimple, Transparent Pricing
Our main product is completely open source and free to use. Need help optimizing your test suite? We're here to assist!
Open Source & Free
Complete access to the Spring Test Profiler
Forever and always
Full test profiling and analysis
Comprehensive HTML reports
Context caching optimization insights
CI/CD integration support
Community support
Expert Consulting
For busy teams who want hands-on optimization help
Tailored to your project needs
Everything in the free version
Deep-dive analysis of your test reports
Custom optimization recommendations
Hands-on implementation support
Direct access to our experts
Why We Offer Consulting
We know development teams are busy shipping features and don't always have time to dive deep into test optimization. That's why we offer expert consulting to help you implement the recommendations from your Spring Test Profiler reports. Our goal is to get your test suite running faster, so you can focus on what you do best - building amazing software!
Ready to Get Started?
Start optimizing your Spring Boot tests today with Spring Test Profiler.